Dashboard Development
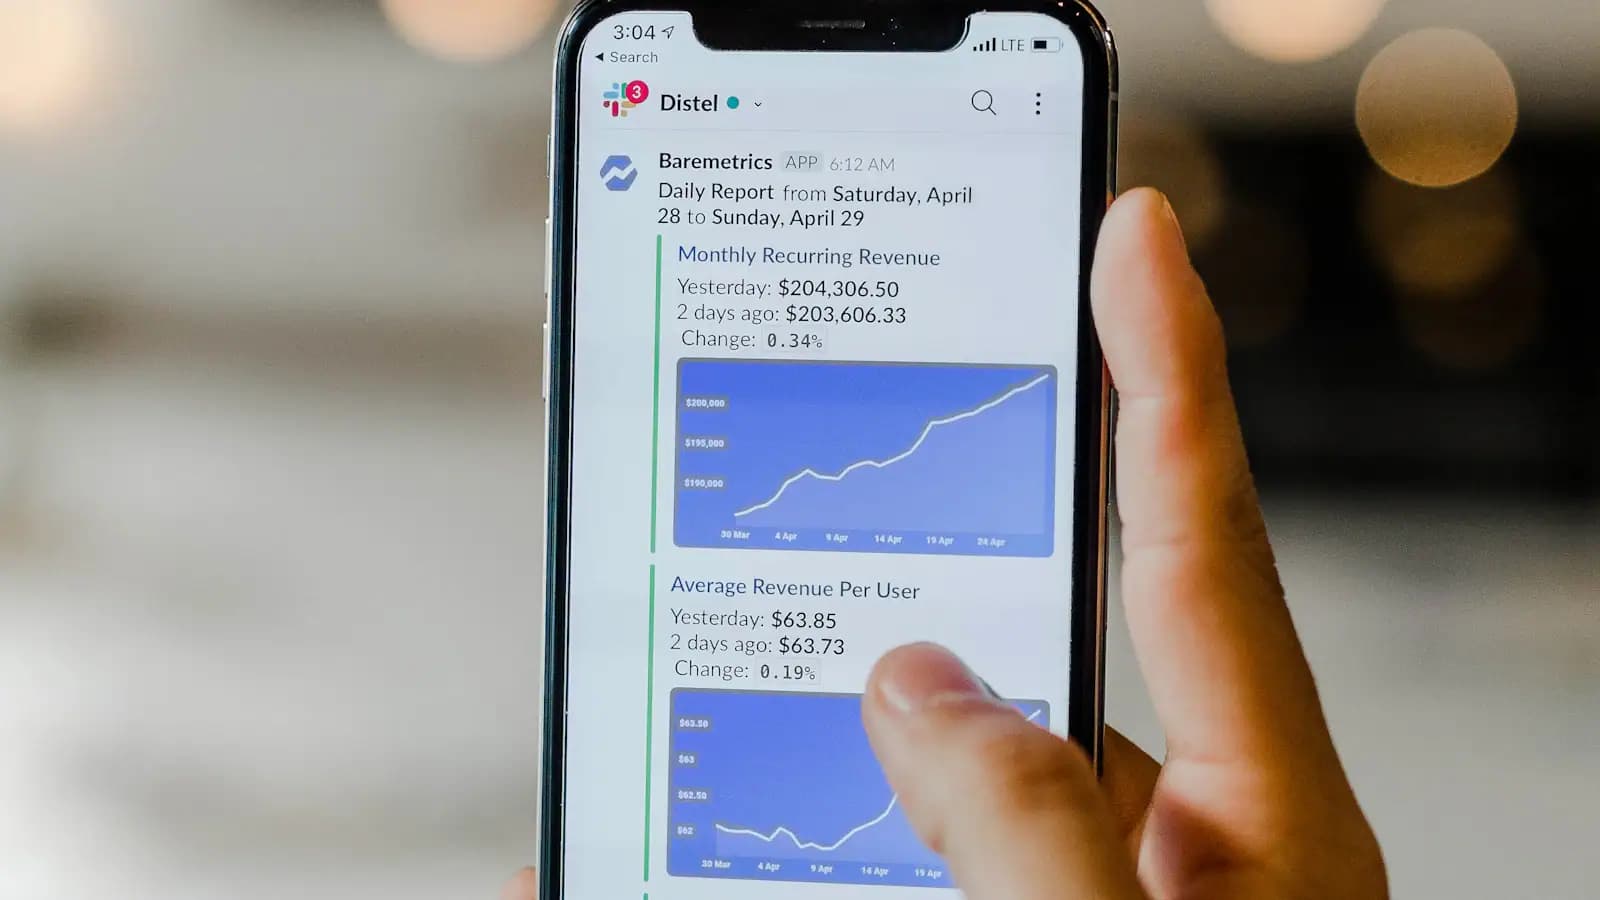
Dashboard Development
A good dashboard answers a specific question rather than displaying everything available. A dashboard with forty metrics goes unread, while one with five tied to a…
In short: A good dashboard answers a specific question rather than displaying everything available. A dashboard with forty metrics goes unread, while one with five tied to a decision gets opened daily.
What is Dashboard Development?
Dashboard development turns scattered data into a screen that supports a decision. It covers connecting sources, designing metrics and presentation. Its value lies in selection: what is shown and what is left out.
Why Dashboard Development is worth the investment in Saudi Arabia
- Automating repeated work: Custom systems remove the duplicate data entry between departments that is the single biggest source of error in companies running operations on spreadsheets.
- Integrating with what you already run: An off-the-shelf product imposes its own workflow; a custom system connects to the accounting, inventory and payment tools you actually use.
- Owning the code and the data: You hold the source and the database, so you are not exposed to subscription increases and you do not lose your data when you change vendors.
- Scaling with growth: You add the modules you need when you need them, rather than paying upfront for a suite you use 20% of.
Who needs Dashboard Development?
- Management teams assembling reports manually from several systems
- Companies with plenty of data that does not reach a decision
- Companies needing live operational performance tracking
Core capabilities
- Metrics tied to decisions: Showing only what changes a decision, because a metric with no consequent action is noise hiding what matters.
- Connecting multiple sources: Bringing data from different systems into one place rather than periodic manual assembly consuming days.
- Role-specific dashboards: A different view per level: operations needs live detail, management needs trends.
Technologies and tools
These are the tools we actually use on Dashboard Development projects. Which ones apply depends on the size and budget of the project, not on what is newest:
- Node.js
- Python
- Laravel
- .NET
- PostgreSQL
- MySQL
- Redis
- Docker
- REST/GraphQL APIs
Cost and timeline in Saudi Arabia
| Tier | Scope | Indicative cost (SAR) | Duration |
|---|---|---|---|
| Starter | Limited scope, core functionality | 15,000 - 40,000 | from 6 weeks |
| Standard | Full scope with integrations | 40,000 - 150,000 | 6-24 weeks |
| Advanced | Enterprise scope, complex integrations | 150,000+ | 24+ weeks |
These are indicative 2026 ranges for the Saudi Arabia market, not a quotation. Actual cost is set after a scoping session, and the largest driver is usually the number of external integrations rather than the number of screens.
How a Dashboard Development project runs
1. Process analysis and requirements
Sessions with process owners to document current workflow and locate bottlenecks, ending in a signed-off requirements document and prototypes.
2. Data model and architecture design
Schema, relationships and API contracts are designed before any code is written, because restructuring after launch costs ten times more.
3. Incremental development
The system is built in short cycles, each producing a usable, reviewable module, rather than one delivery at the end.
4. Testing and data migration
Unit, integration and acceptance tests, then migration of historical data from the old system with a reconciliation report.
5. Launch and parallel running
The new system runs alongside the old one for a period, with user training and performance monitoring before the old one is retired.
Best practices
- Ship the smallest working version first: Release the module that solves the biggest operational pain, gather user feedback, then build the rest.
- Automated tests around financial logic: Any code computing prices, tax or balances must be test-covered — one error there shows up on every invoice.
- Separate business logic from the interface: It turns adding a mobile app or an external integration later into days of work instead of a rewrite.
- Document the API from day one: OpenAPI documentation lets a new developer or an integration partner work without a verbal handover.
- Plan backup and restore: An untested backup is not a backup; actually rehearse a restore every quarter.
Common mistakes to avoid
- Building every module before launching any: Months later you discover half of what you built goes unused. Release incrementally.
- Leaving data migration until the end: Legacy data is always messier than expected; start cleaning it in the first phase.
- No single owner on the client side: Without one person who can decide, reviews turn into conflicting opinions and phases slip.
- Depending on one developer who knows everything: Their absence stops the project; require documentation and second-party code review.
- Ignoring performance until data grows: A query that is fine on a thousand rows can stall at a million; test with realistic data volume.
What is specific to Saudi Arabia
The Saudi market operates under Vision 2030, which has pushed government and semi-government bodies to require specific levels of digitisation from their suppliers. In practice that means a company dealing with a government entity needs compliant e-invoicing and integration with national platforms, not merely an internal system that works.
- Right-to-left Arabic support is a baseline requirement for local user acceptance, not an optional extra.
- Local payment rails such as Mada and Apple Pay carry a large share of transactions and must be supported alongside international cards.
- The Wage Protection System requires salaries to be paid through approved channels, so any HR system must export files in the required format.
- Dealings with government entities run through national platforms, and a company unable to integrate with them is excluded before its proposal is assessed.
Frequently asked questions
Q: How many metrics should a dashboard have?
A: Five to nine per screen. More than that and the eye does not know where to look. A metric with no consequent decision should be removed rather than made smaller.
Q: Do I need a data warehouse?
A: Not always. A dashboard reading from one system can connect directly. A warehouse becomes justified when combining multiple sources or when queries affect operational system performance.
Q: Real-time or periodic?
A: It follows the decision. Operational monitoring needs live updates; management reporting is served by daily refresh. Requiring real-time without need raises cost and complexity for nothing.
Q: Could another developer continue the work?
A: Yes, and it is a standard we hold ourselves to: documented code in a conventional structure with build and deployment documentation, so you are not tied to us for future changes.
Q: How do you handle our existing data?
A: We start by assessing its quality and cleaning it before migration. Messy data migrated as-is produces reports nobody trusts in the new system.
Q: Do you provide team training?
A: Yes — role-based training close to launch rather than months before, with a short usage guide for each screen the team actually uses.
Conclusion
Dashboard Development is less a purely technical decision than an operational one: the difference between a project that lands and one that stalls usually shows up in how clearly the scope was defined before starting, not in the choice of technology. Begin by stating precisely which problem you are solving, then ask any prospective partner how they intend to measure success.
Codlex Tech is a software development company working since 2020 with clients across Saudi Arabia, Egypt and the Middle East on websites, mobile apps, e-commerce, ERP and CRM systems.
Contact: [info.codlextech@gmail.com](mailto:info.codlextech@gmail.com) — [+201223280094](tel:+201223280094) — [codlextech.com](https://www.codlextech.com)
Latest Articles

Best Software Companies in Saudi Arabia: A Complete Guide 2026
Choosing a software company is settled by two questions rather than a portfolio: what do I receive at handover, and who could continue the work after you? A company…

Software Development Cost in Saudi Arabia
Software cost follows integration count and business logic complexity, not screen count. A ten-screen system connecting to e-invoicing, inventory and payment costs…

POS System Development
A POS is judged by entry speed at peak and by whether it works offline. A purely cloud system that stops when the network drops stops sales, which no real point of…
Cloud Solutions in Saudi Arabia
Cloud in Saudi Arabia carries an extra consideration: some sectors require data to remain inside the Kingdom.

HR System Development
An HR system starts with attendance and leave because they are the most repetitive and most disputed.

School Management System Development
A school management system is measured by whether parents actually use it: a system parents do not open pushes the school back to paper notes and phone calls.

Healthcare Software in Saudi Arabia
Healthcare software operates under a constraint others do not have: patient data is legally sensitive, and encryption and audit logging are not additional features…

Real Estate Software in Saudi Arabia
Property software differs from generic systems in managing unique inventory: every unit is different and does not repeat.

Restaurant Management System
A restaurant management system turns wastage from a vague month-end number into an explainable figure.
Logistics Software in Saudi Arabia
Logistics software is judged by its effect on cost per shipment rather than its feature count.

Blockchain Development in Saudi Arabia
Blockchain solves one specific problem: needing an unalterable record shared between parties who do not trust each other.

AI and Machine Learning in Saudi Arabia
Corporate AI projects succeed when they start from one repeated task with a clear success metric.